Twenty years ago, the ports of Charleston and Savannah were close to even.
In the first nine months of 2006, the South Carolina State Ports Authority handled about 1.49 million 20-foot equivalent units, or TEUs, the standard measure of container cargo. The Georgia Ports Authority’s Port of Savannah handled about 1.59 million.
This year, Savannah handled 4.37 million TEUs from January through September, 2.4 times the 1.79 million that moved through SC Ports’ terminals, according to a Charleston Business Report analysis of monthly figures the two authorities publish. That is the widest gap for those months since at least 2003, the earliest year in the Georgia authority’s published monthly figures. Charleston handled more TEUs than Savannah in the first nine months of each year from 2003 through 2005.
Charleston’s share of the two ports’ combined volume fell to 29.1% this year from 31.1% in the same months of 2025. It was 48.2% in 2006.
A divergence in 2026
The two ports have been moving in opposite directions this year.
SC Ports’ container volume fell 8.7% in the first nine months of 2026, to 1,794,157 TEUs, according to its own figures. That is its lowest January to September total since 2020, when the pandemic disrupted trade.
Savannah’s volume rose 0.4% over the same months, to 4,374,610 TEUs, the analysis found. It was Savannah’s second-busiest January to September in its records, behind 2022.
The gap widened in the three months since both authorities began new fiscal years on July 1. SC Ports’ TEU count fell 7.2% from July through September. Savannah’s rose 2.7%, by 40,560 TEUs, which the Georgia authority said made it the second-best quarter in its history.
In September alone, Savannah handled 504,015 TEUs, up 3.7% and a record for the month, the Georgia authority said. Charleston handled 201,773, down 5%.
Imports make the difference
Most of the divergence is in imports.
Charleston’s loaded imports fell 8.2% in the first nine months of the year, a drop of 77,870 TEUs, according to SC Ports. Savannah’s loaded imports rose 2.7%, a gain of 58,504 TEUs, the analysis of Georgia Ports Authority data found.
Exports moved little at either port. Loaded exports fell 0.4% in Charleston and 1.2% in Savannah.
Empty containers, which shipping lines send back overseas to be refilled, tell a similar story. Charleston shipped out 17.5% fewer empties, measured in TEUs. Savannah shipped out 2.2% fewer.
The numbers do not show where any particular importer’s cargo went. Shipping lines and the companies that hire them choose ports based on vessel schedules, rail service, costs and where their warehouses and customers are, and a cargo owner that left Charleston could have shifted to any port or simply imported less.
How the rest of the coast is doing
Charleston’s decline is the steepest among the large East and Gulf Coast ports included in the analysis.
The Port of New York and New Jersey, the busiest on the East Coast, handled 5,983,310 TEUs from January through August, down 1.1%, according to the Port Authority of New York and New Jersey. It had not posted September figures as of Oct. 22. Over the same eight months, Charleston was down 9.2% and Savannah was essentially flat, with 1,004 more TEUs than a year earlier.
Port Houston, which says it handles about three-quarters of the Gulf Coast’s container traffic, handled 3,349,547 TEUs from January through September, up 2.4%, according to its unaudited figures. Its September volume rose 11.5%.
Jacksonville’s port authority, JAXPORT, reports on a fiscal year that ended Sept. 30. Its monthly figures for that year add up to about 1.32 million TEUs, 4.8% below the 1.39 million it reported for the year before, the analysis found.
The Port of Virginia, another major competitor, does not post monthly volume figures on its website, so it is not included.
A longer slide
Charleston’s slip against Savannah is not new. Measured over the first nine months of each year, its share of the two ports’ combined volume fell from about 48% in 2006 to about 34% by 2009 and held between about 32% and 35% from then through 2023. It dropped to about 31% in 2024 and 2025 before this year’s decline.
Over the full 2025 calendar year, Savannah handled 5,691,480 TEUs to Charleston’s 2,565,297, according to the two authorities.
On a fiscal-year basis, SC Ports’ TEU count fell 4.9% in the year that ended June 30, to about 2.44 million, the analysis found. Savannah’s fell 0.6%, to about 5.67 million.
What SC Ports is doing
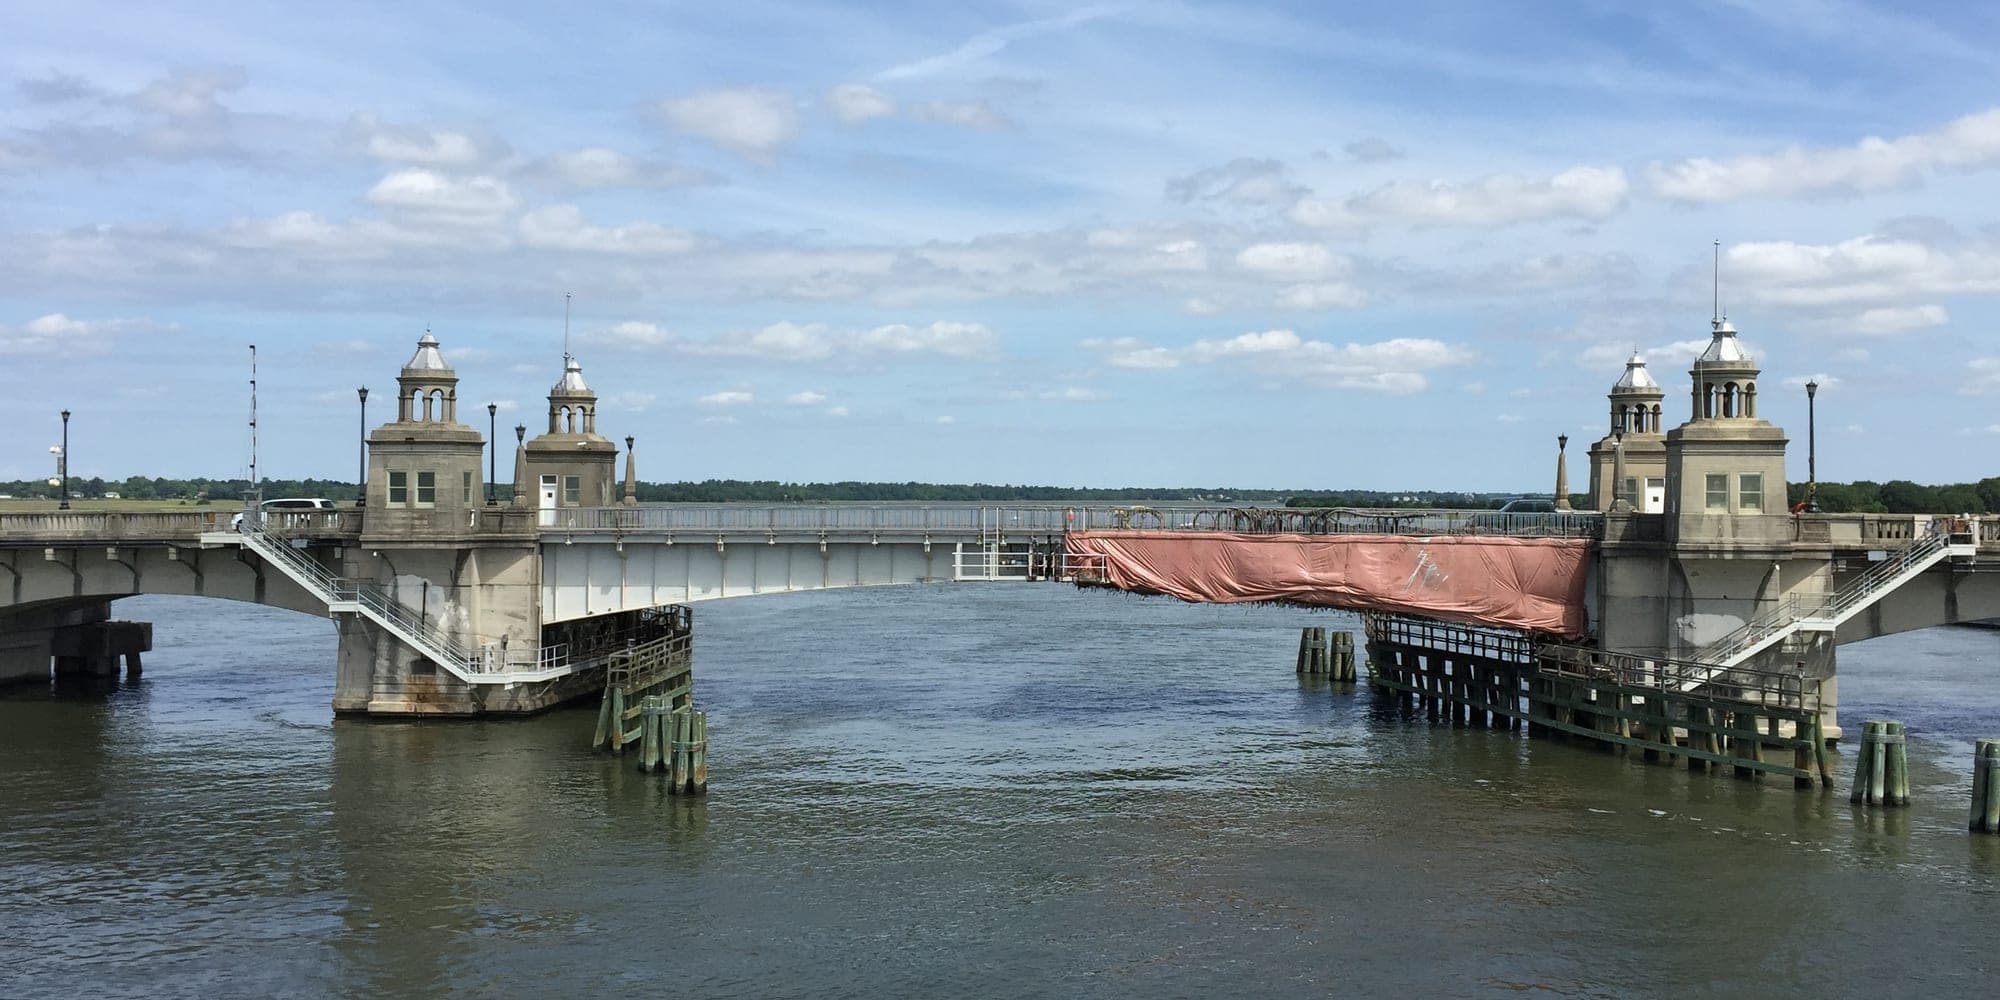
SC Ports has cut costs and idled its newest container terminal as volume has fallen. Hugh K. Leatherman Terminal in North Charleston, idled Aug. 1, handled no containers in September, the authority’s figures show. Most of the ships that called there were to move to North Charleston Terminal, with larger ones that can’t clear the Don Holt Bridge going to Wando Welch Terminal, The Post and Courier reported in June.
President and CEO Micah Mallace said in August that the rates the port charges container lines had drifted out of line with those of regional competitors, and that cutting internal costs would let the authority bring them back in line, the SC Daily Gazette reported.
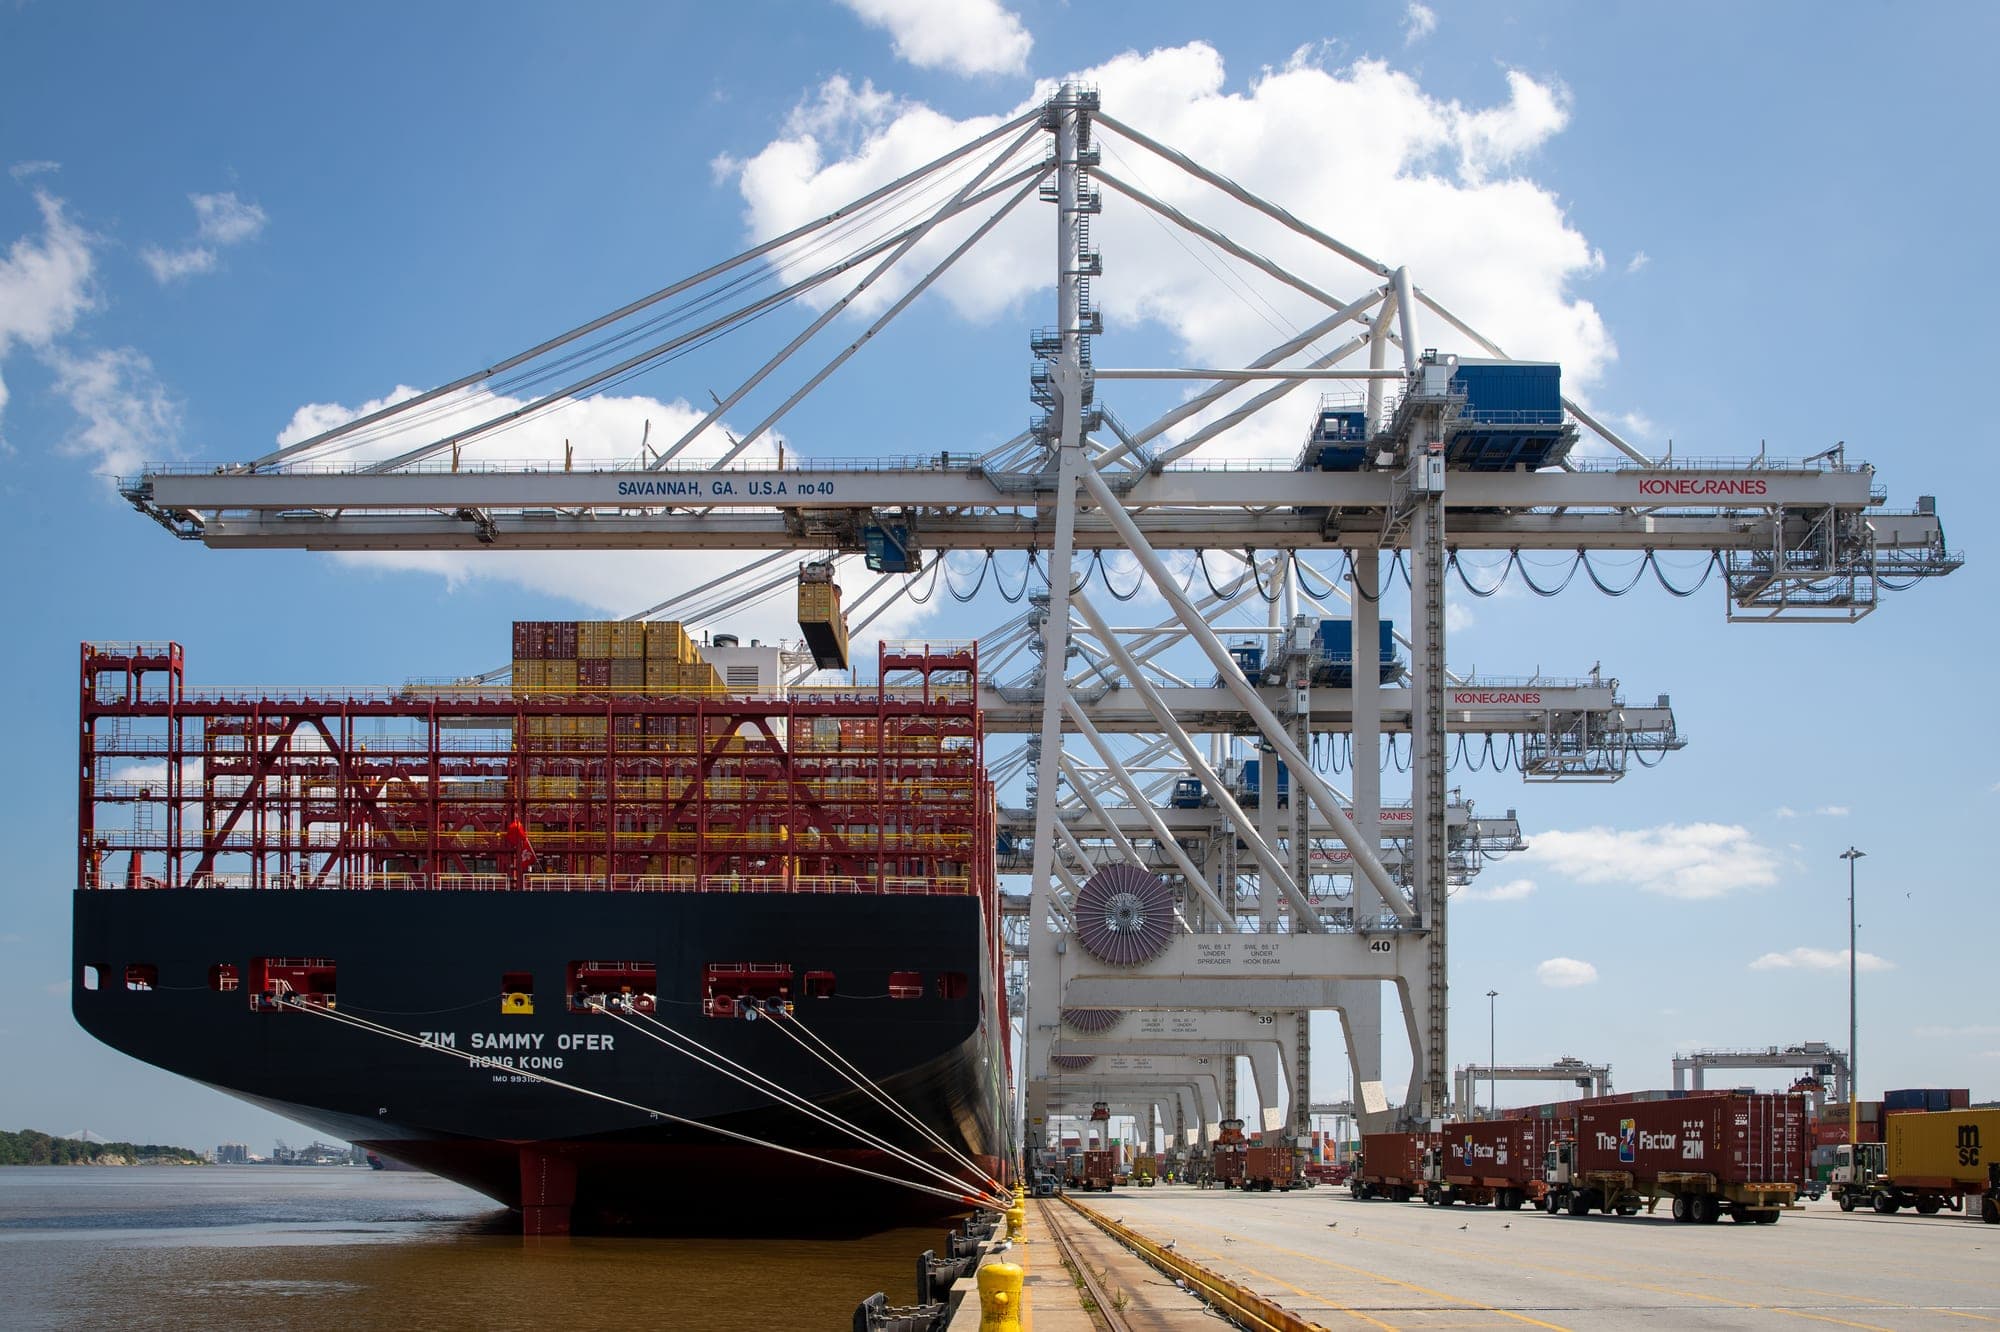
Savannah, meanwhile, is adding room. The port has 7.75 million TEUs of annual container capacity, and the Georgia authority is spending $1.6 billion to expand its Ocean Terminal there, WTOC reported Oct. 14. It also plans a 3.5 million TEU terminal on Hutchison Island, with construction expected to begin in January 2028, the station reported.
How we did this
We used monthly TEU counts published by each port authority: SC Ports’ TEU history reports, which go back to 1997, and its year-to-date volume reports, the Georgia Ports Authority’s monthly TEU throughput report for Savannah through September 2026, the Port Authority of New York and New Jersey’s monthly cargo tables through August, Port Houston’s monthly TEU statistics and JAXPORT’s monthly statistics page. We added monthly figures to compare the same months in each year and calculated each port’s change and Charleston’s share of the Charleston and Savannah total. SC Ports’ figures cover its marine terminals. Figures are the authorities’ own and may be revised.